
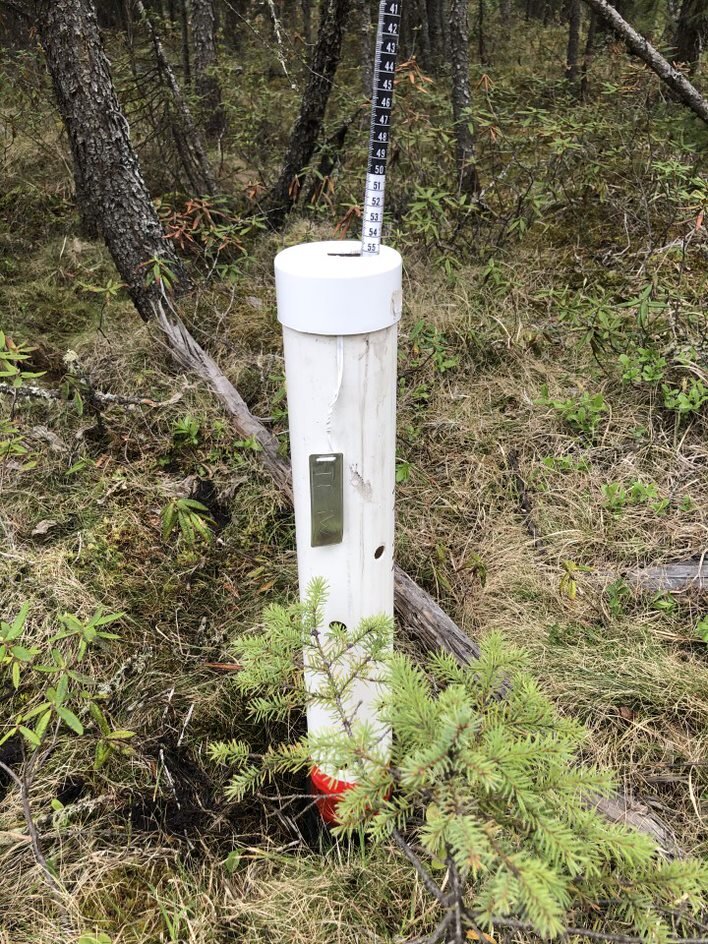
iWetland is a citizen science project - a joint effort between researchers and the public to collect data on wetland water levels. Along the wetland interpretive trail, you will find three monitoring wells (large white tubes with rulers) set up so anyone can record a water level measurement and participate in this citizen science project.
HOW TO PARTICIPATE
Things you will need
A phone to record data.
OR
A piece of paper, a pencil/pen (we recommend a pencil in case of rain or your paper getting wet), and a hard surface to write on.
Looking for a datasheet to print to bring with you to the field? Download it here.
Steps
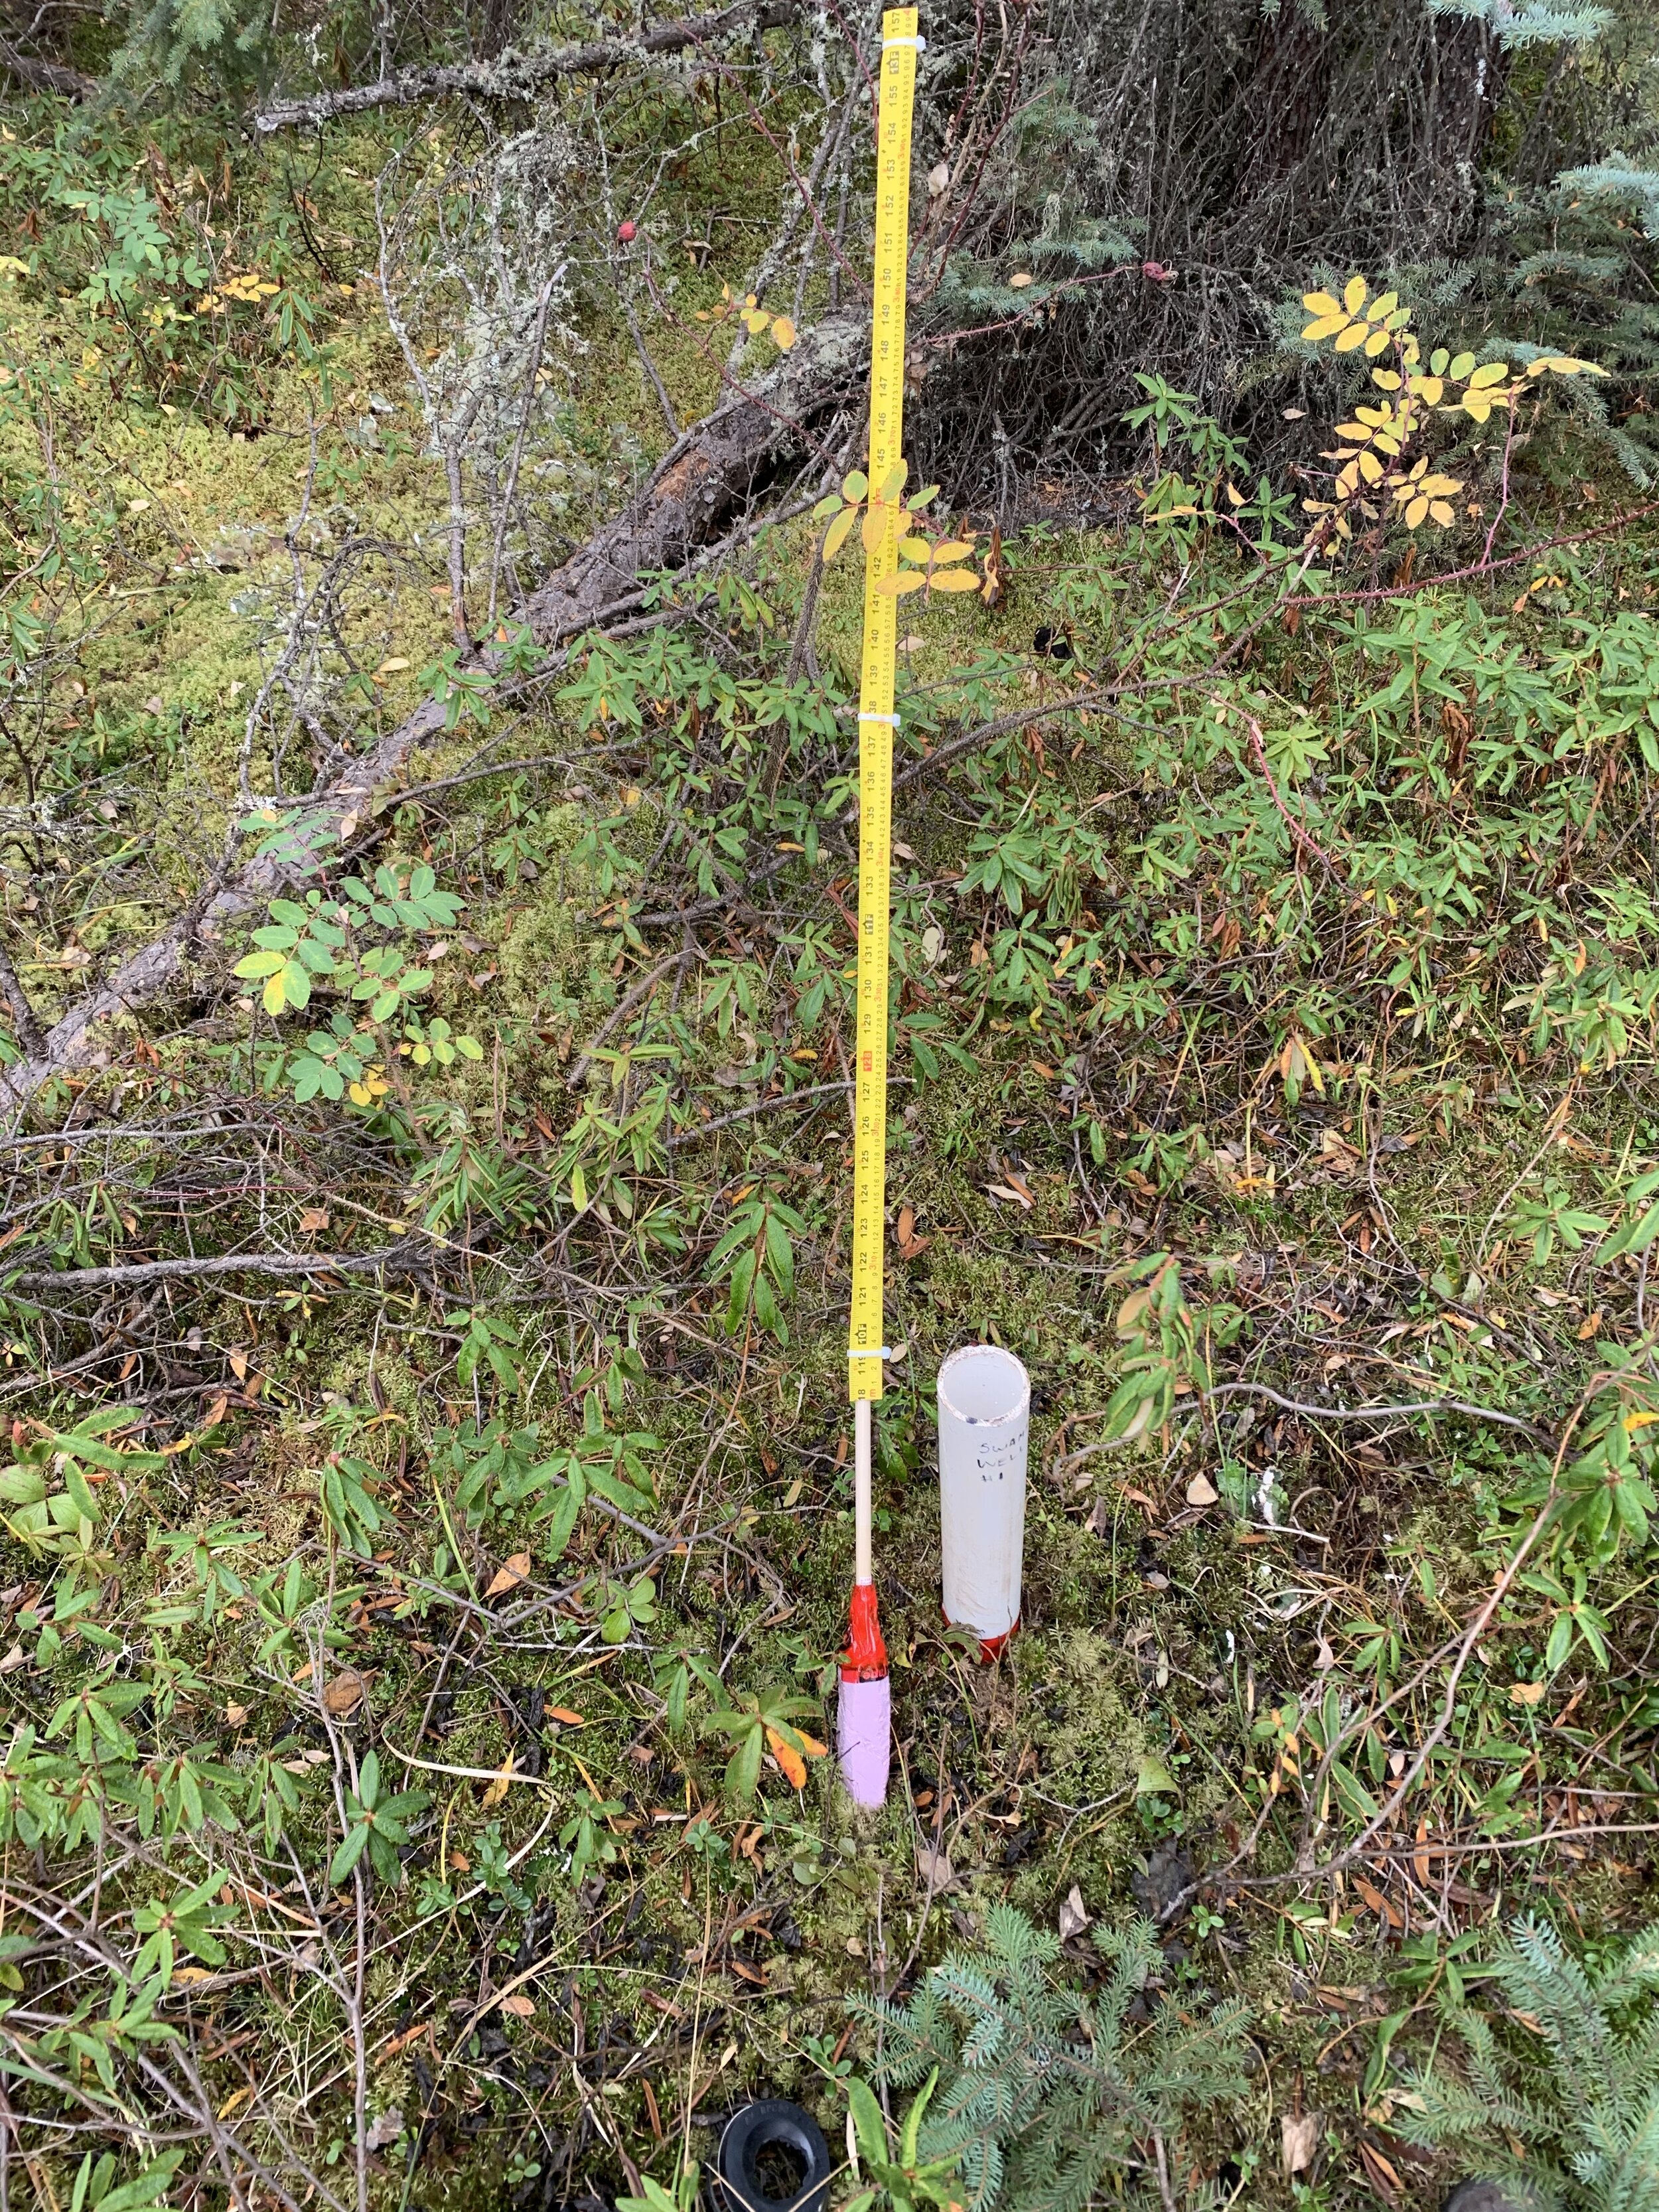
Locate one of the three iWetland monitoring wells at the site (see map at bottom of page).
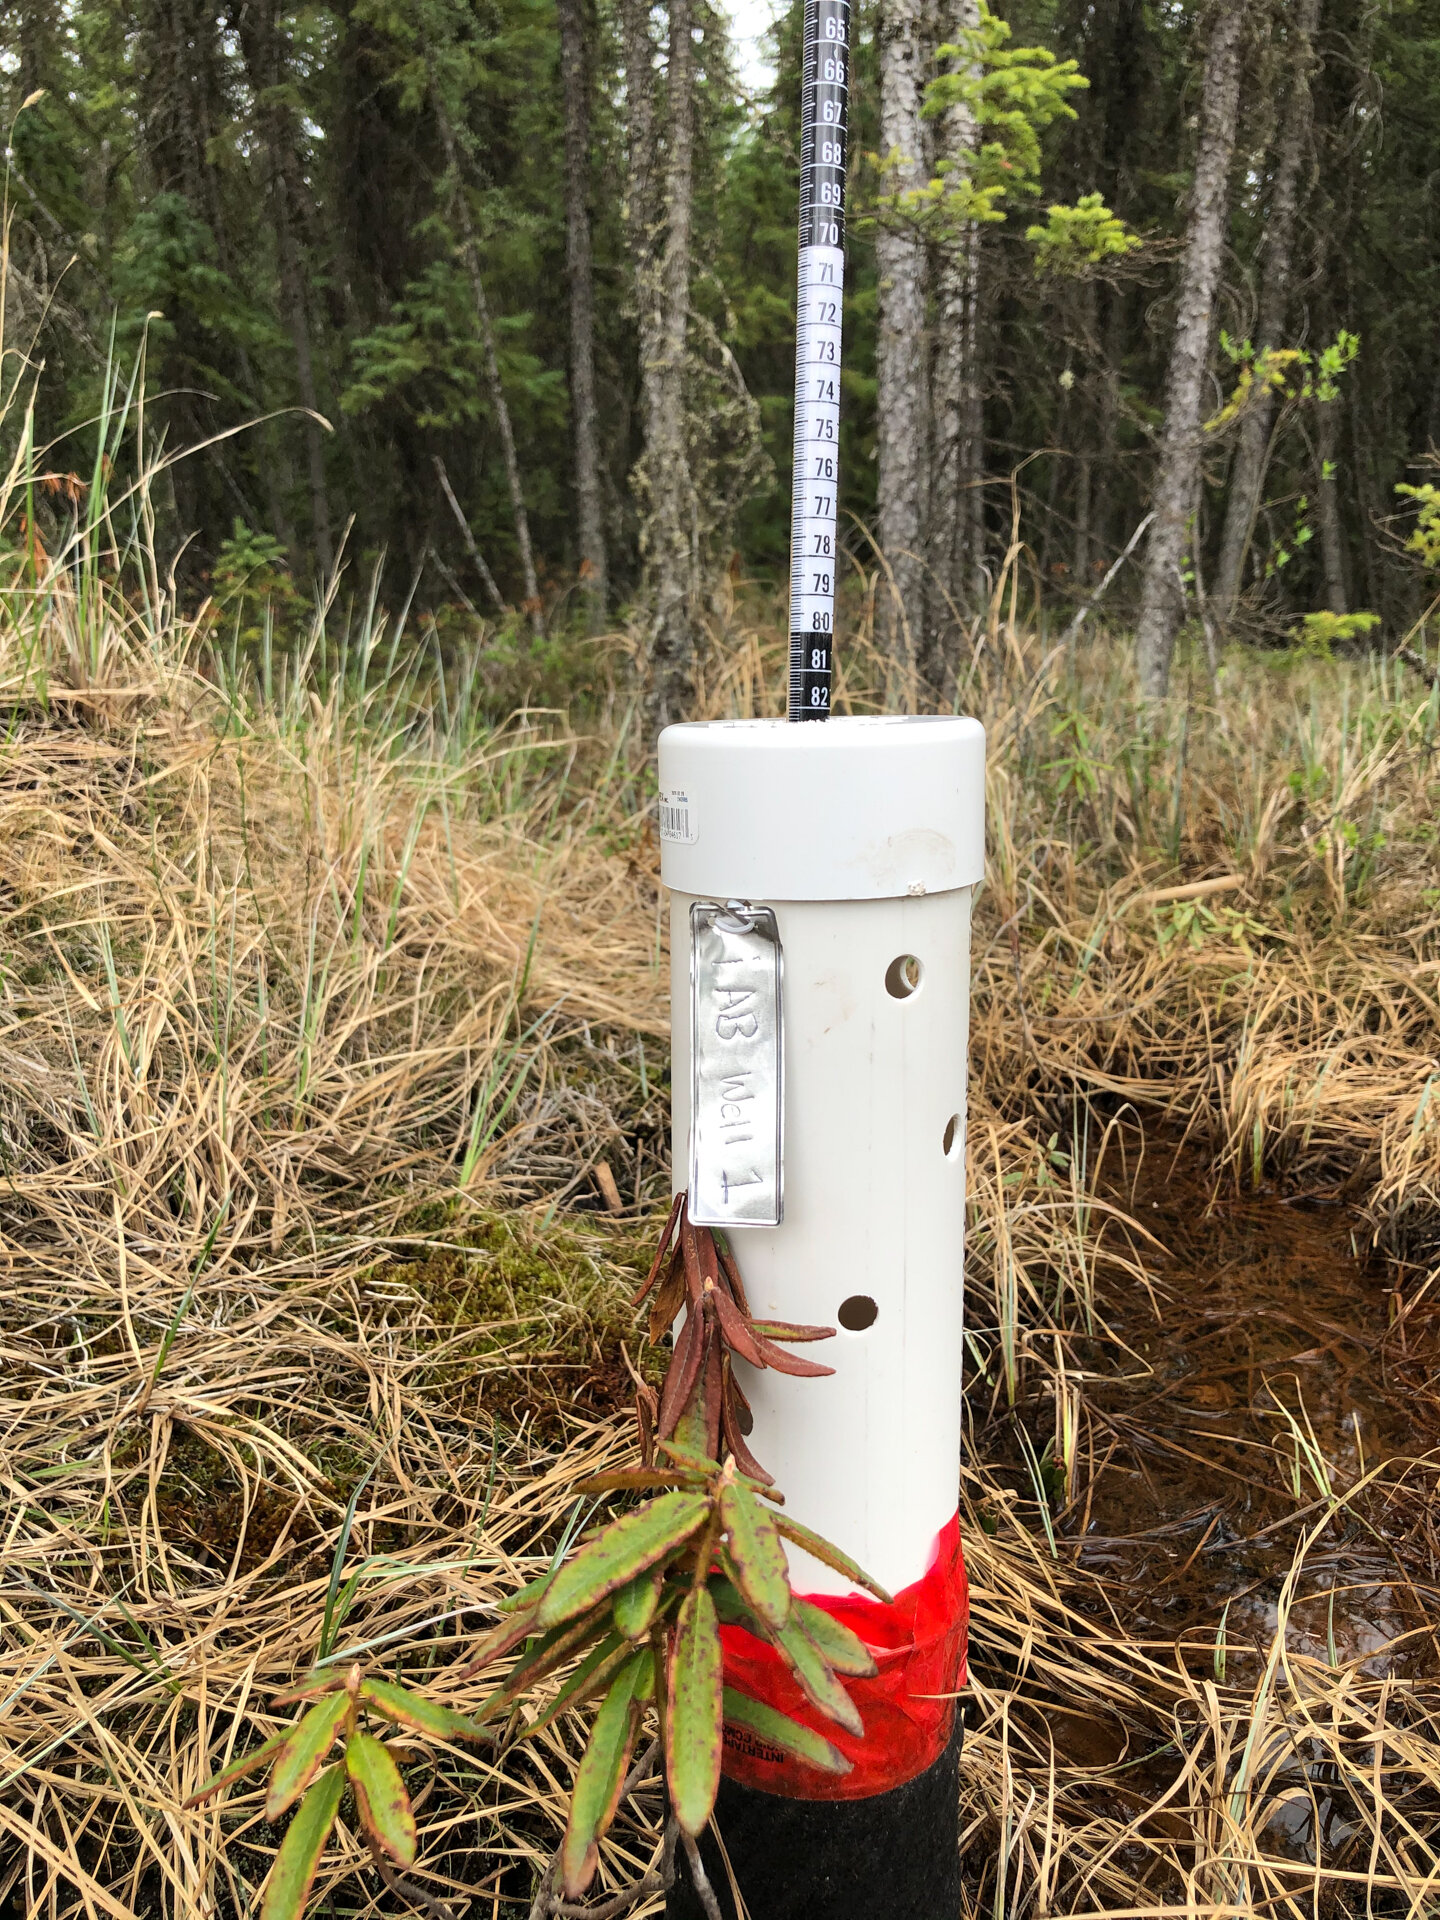
Record the well ID (each iWetland well will have an information sign that lists the name (ID) of the well), the date, and the time.
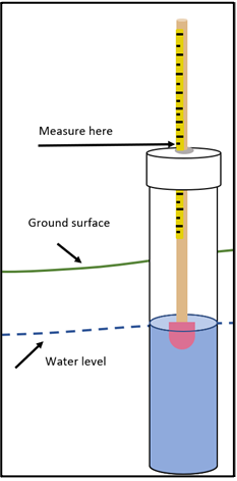
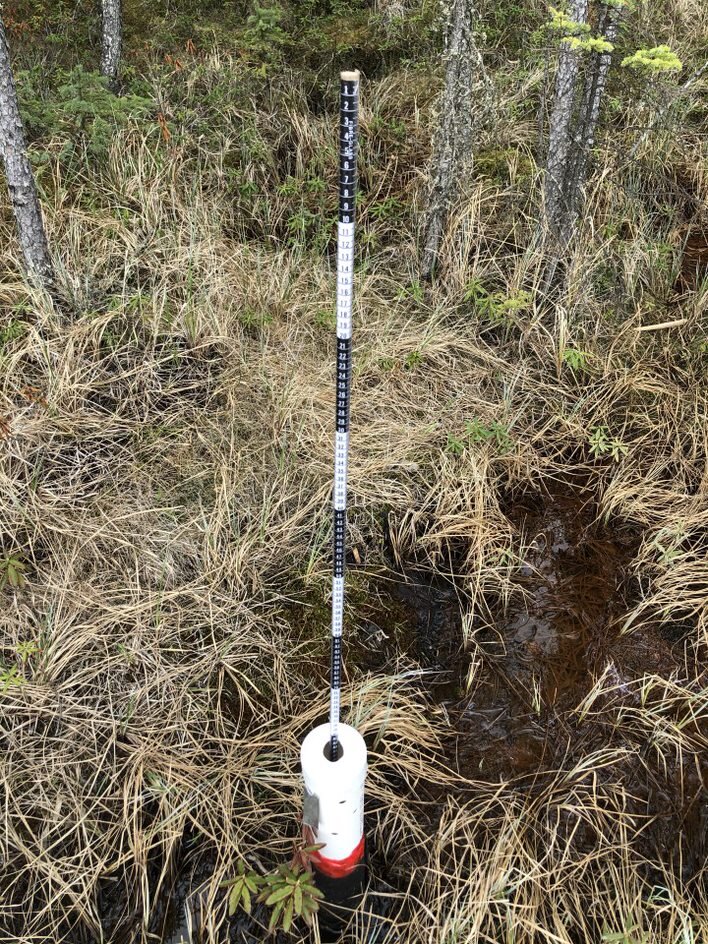
Record the number (cm) that is closest to where the ruler enters the well. This number is not the actual water table depth but is used to calculate it.
Submit these four pieces of data (1. well ID, 2. date, 3. time, 4. water level) by email to c_brown@ducks.ca.
You can submit the data either while you are in the field or at a more convenient time.
BACKGROUND
As the water table rises and falls, the float inside the monitoring well moves with it.
In 2017, the iWetland project was initiated in Ontario by McMaster University. The project showed great success in data collection and as a citizen science activity - in August 2019, 278 people recorded and submitted water level readings! For more information on the McMaster iWetland project, view the recording of the 2020 iWetland webinar.
With the success of the McMaster led iWetland project in public engagement and data collection, DUC was interested in piloting this project and creating COVID-19 safe opportunities for volunteers. In collaboration with Dr. Scott Ketcheson at Athabasca University and McMaster University, DUC has extended the geographic scope of iWetland, and in 2020 installed three wells at the Boreal Wetland Centre, County of Grande Prairie, Alberta.
WHY PARTICIPATE?
Researchers are often limited in their work by insufficient or incomplete data sets. Citizen science projects increase the amount of data that is collected and helps researchers access larger sets of data and sometimes rare data that they otherwise would not have access to. Citizen science also offers interested members of the public an opportunity to learn more about scientific processes and the natural world in a hands-on way!
The data collected will be used to see how the water levels change in the short term (weekly), and longer-term (yearly). Once data is collected, we will share the results at the bottom of this page. Read more on why water levels here.

DUC staff demonstrating how to Record and submit a measurement from the well (white tube)
WHO CAN PARTICIPATE?
Everyone is welcome to participate! iWetland is an inclusive project for anyone interested in getting involved regardless of age/background.
Are you an educator interested in getting your students involved? Contact us and we can work with you to adapt materials and resources for your field day!
Rain or shine, data can be collected in any weather conditions! The project is active from every year from June to October.
DATA COLLECTED
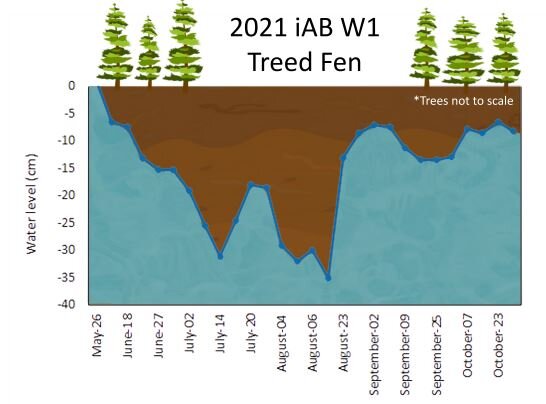
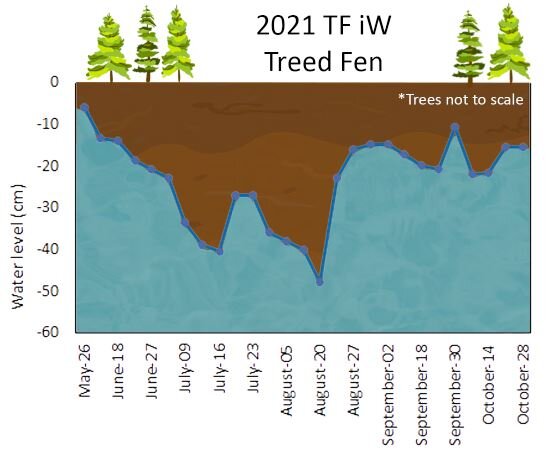
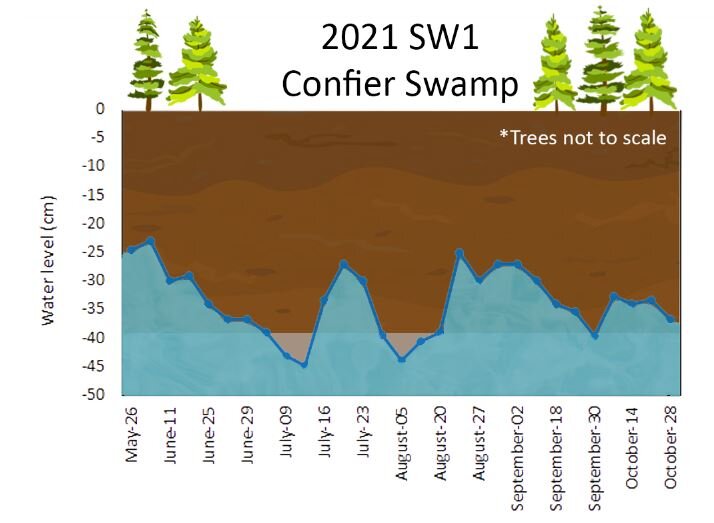
Data was collected from May to October 2021. The graphs show the water level dropping deeper (further below the ground surface) from August. This trend is typical of spring to summer conditions in boreal wetlands, especially when there hasn’t been much rain at the site. In late-August, the water level rose as seasonal precipitation increased.
Additional details:
The line on the left of the graph is the y-axis, and in this case, it shows where the water level is relative to the ground surface. The 0 cm mark (top left) is the ground surface, and you’ll notice that all the values below it are negative. A -5 cm value indicates that the water level was 5 cm below the ground surface. Similar for positive values (only 1 in this case, May 26 iAB W1), a value of 5 cm on the graph tells us that there was 5 cm of standing water above the ground surface. Think of it as when talking about temperature - 0 degrees C is the boundary between freezing and not freezing. The difference in this case is 0 cm is the boundary between ground water and standing water.
The line on the bottom of the graphs is the x-axis, and in this case, it tells us the date that the water level measurement was taken (blue dot). Take a look at the 2021 TF iW graph, and find May 26 on the x-axis. Look up above this date until you see the corresponding dot, and then look at the y-axis. We now know that on May 26 the water level was -5 cm, (i.e. 5 cm below the ground surface).
Well Location Map

Click to download
Can be used in Avenza Maps™
This pilot project was supported with funding from TD Friends of the Environment Foundation and Pembina Pipeline Corporation.
Questions or comments? Email Catherine Brown at r_murray@ducks.ca