A Day in the Field at the Wetland Centre with DUC Staff

DUC staff members Leanne and Catherine set off to do some work at the Wetland Centre. Keep reading to get a glimpse into their day in the field!


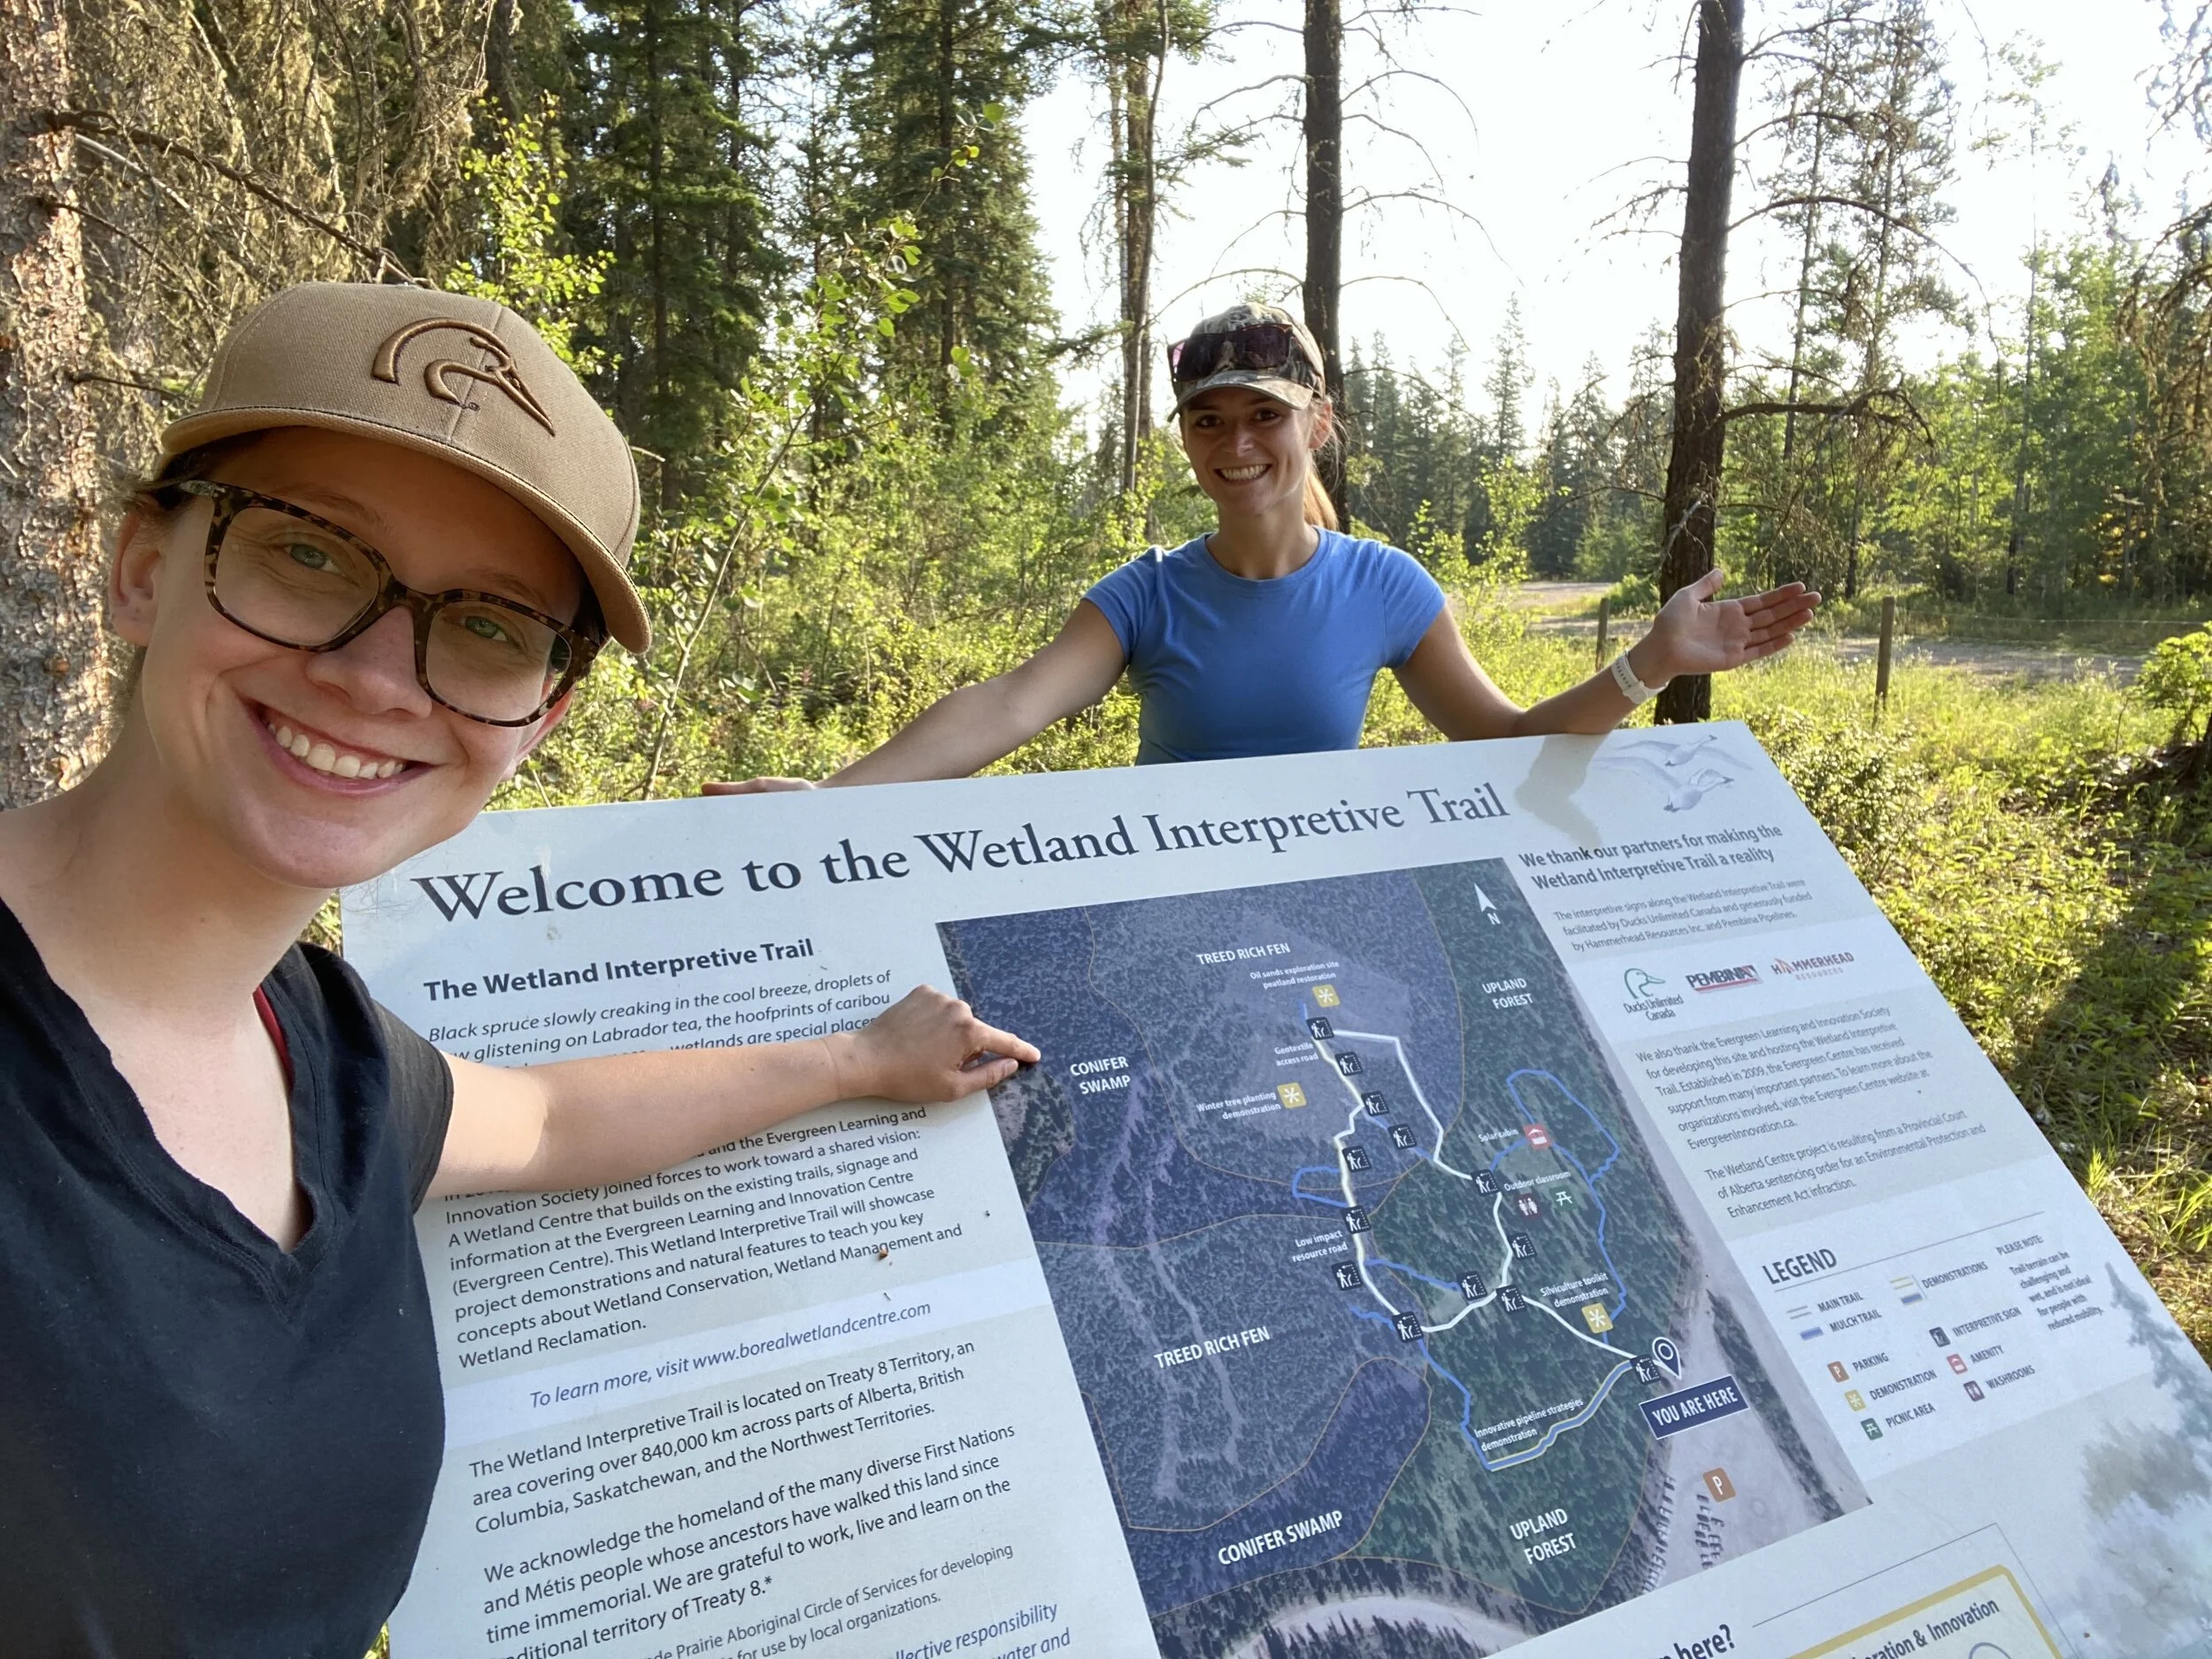
In early August we travelled to the Wetland Centre to maintain some of the citizen science infrastructure, install new equipment and check out the new signs that were recently installed - like this one at the site entrance.

IMG_1567.JPG

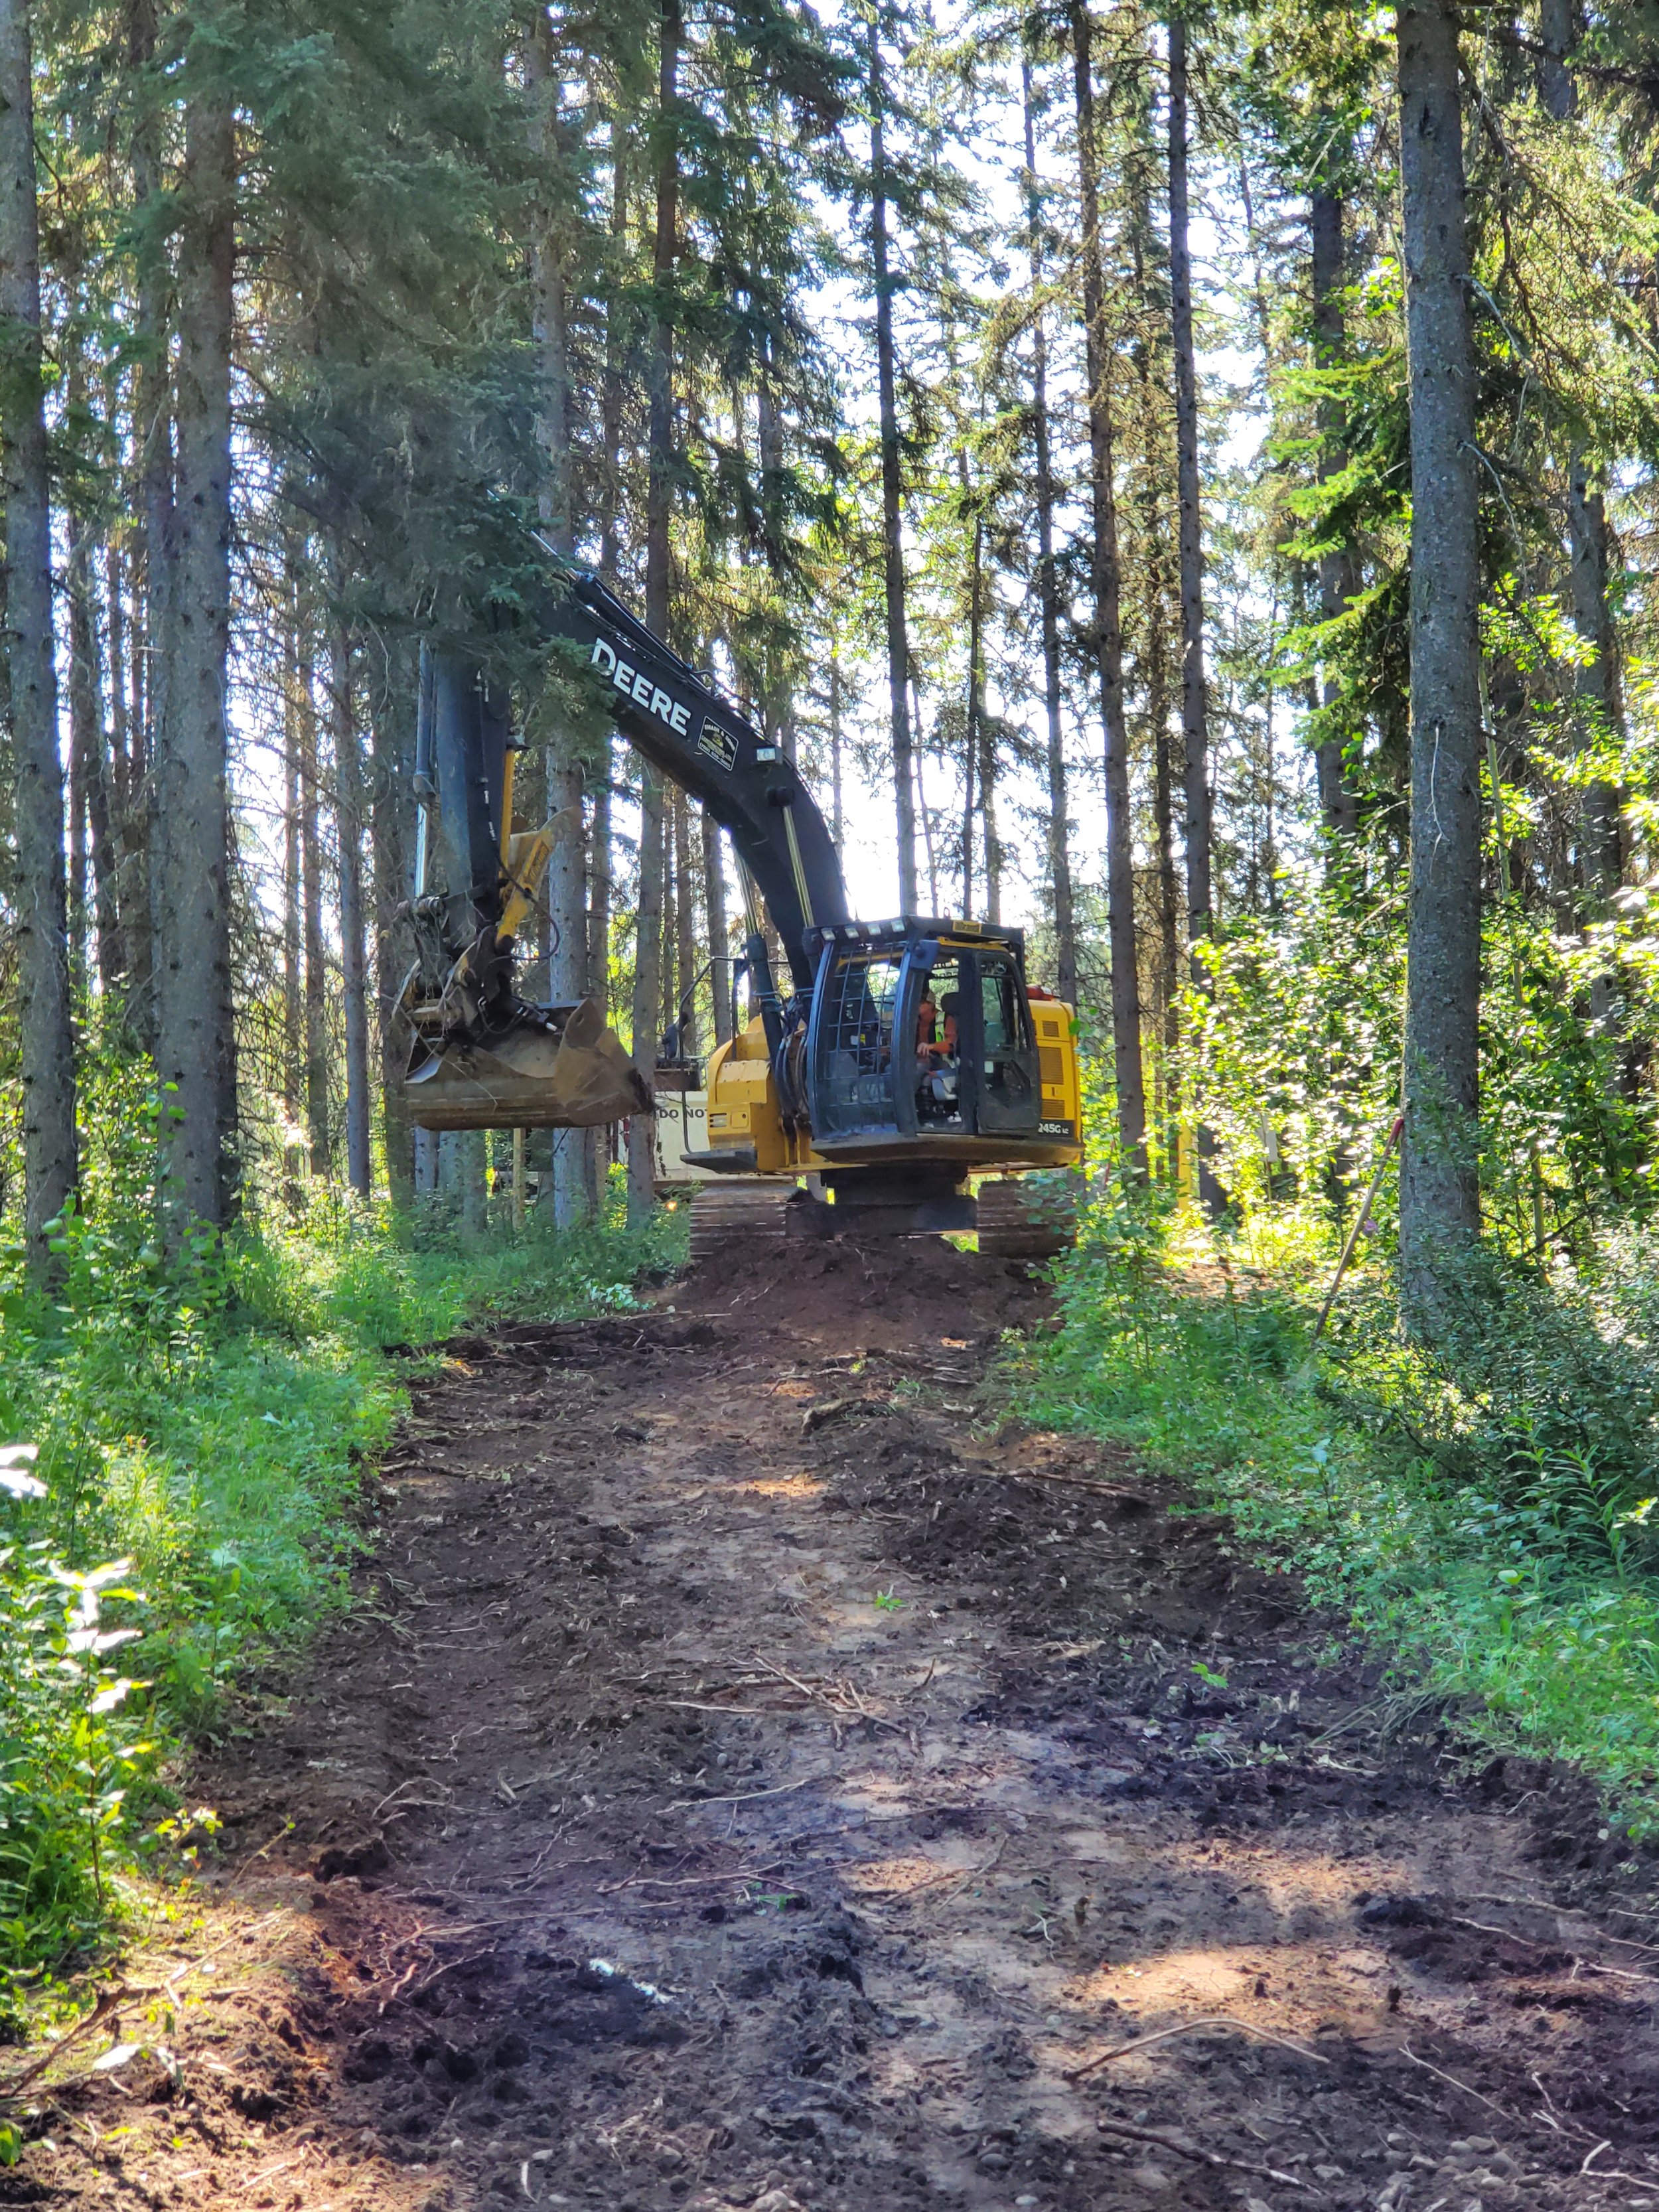
After an initial walk-through of the site, we set to work deploying data loggers that will automatically collect water level measurements as part of the Wetland Hydrology Monitoring project.  We’re using this data to better understand how water levels change over time in different wetland classes. The data collected from the iWetland citizen science project wells will also help support this.

At our third site, we were reminded that sometimes things don’t go according to plan.  With a dry summer, the water level was too low in the well we originally picked to install a data logger at. So, we installed a new, deeper well in a different wetland and were then able to install the data logger.

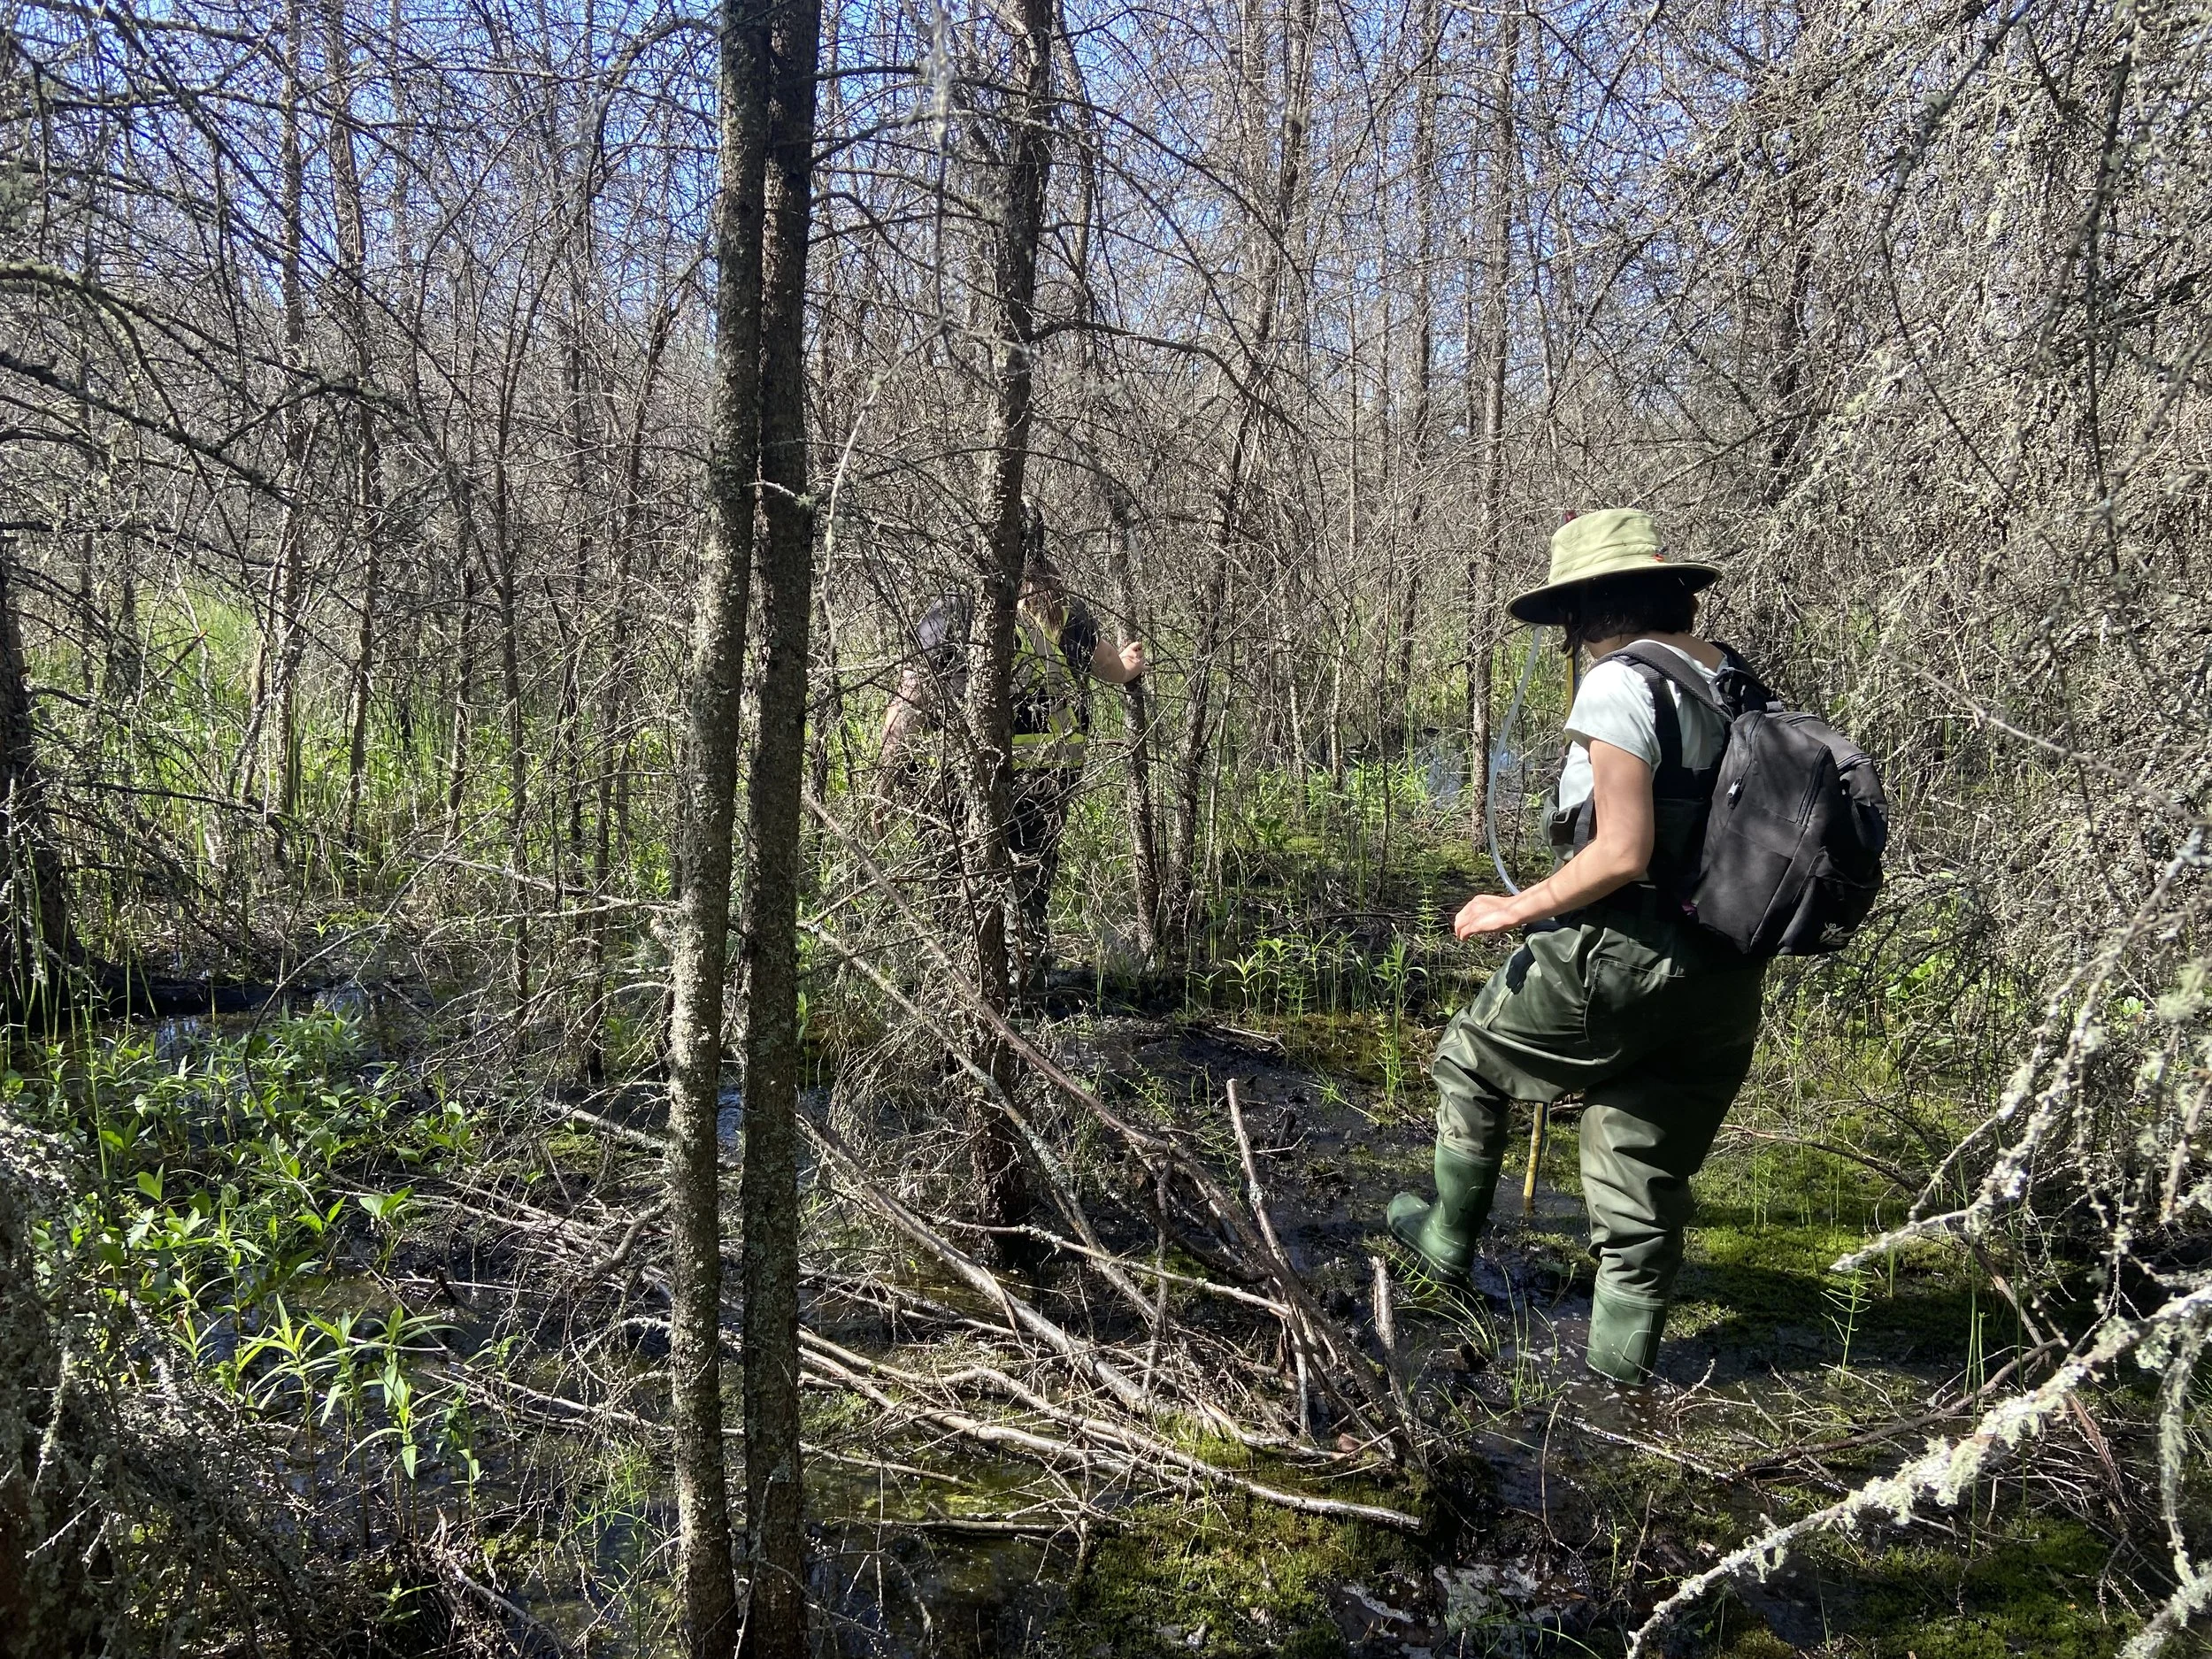
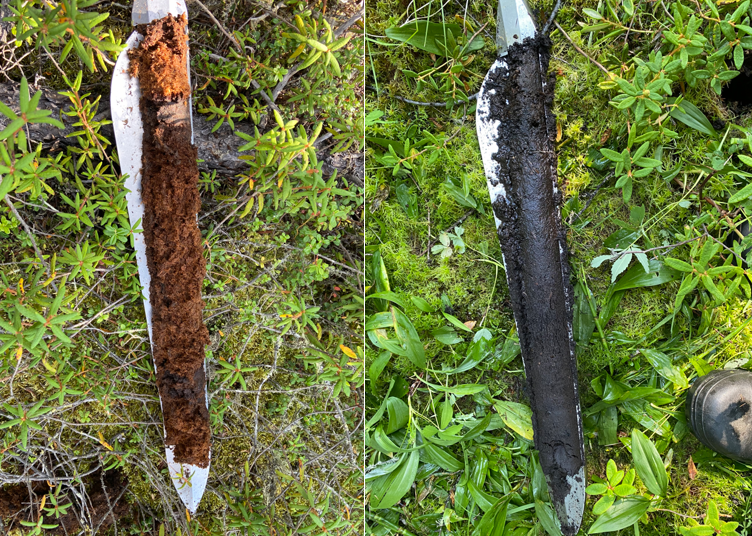
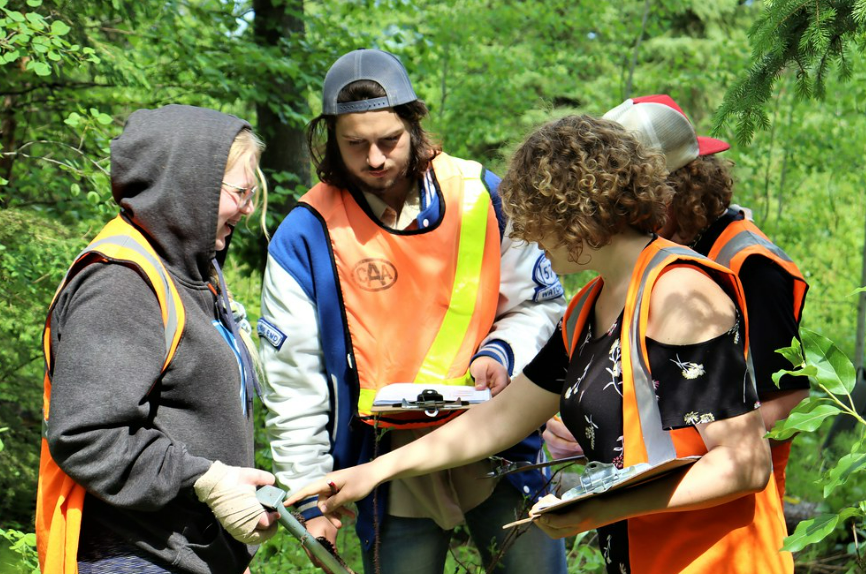
Next, we measured peat depths to fine-tune our wetland maps of the site.  In doing so, we tested out a new tool – an avalanche probe!  The probe should easily push through peat soils, but not the underlying mineral soils, to give us an estimate of peat depth. Because this is a new-to-us tool, we brought a soil auger to double-check our depth estimates.  We found that while the avalanche probe worked in many areas, it was challenging to discern the difference between peat soils and very wet clay soils.  If you can’t detect this transition, you can easily overestimate the depth of the peat. It was a great opportunity to test this new tool but until we get a feel for the changes in soil type, we’ll be using the auger to confirm these measurements.

Installing a new hydrology well

Installing a new hydrology well

Testing out the avalanche probe

We also re-installed several trail cameras throughout the site.  We’ve been using these not only to capture wildlife photos but also to capture changes in plant growth and hydrology in three different wetland types - a marsh, fen, and swamp.

We had a great day getting out of the office and into the field at the Wetland Centre.  With maintenance tasks and equipment installation checked off for the season, we’re now looking at compiling and analyzing the water level, peat depth, and trail camera data collected- and as always… planning for what comes next!

wetlandcentrelast.jpg
IMG_2109.JPG

How Remote Sensing is Used to Map Wetlands: Evergreen Park Wetland Mapping Extension Project

Becky Edwards, DUC (on Twitter @Becky_Maps)

Over the past 20 years, Ducks Unlimited Canada’s (DUC) National Boreal Program has been the leading force in providing detailed and accurate wetland mapping inventories for the boreal forest. To date, DUC has mapped approximately 200 million acres of wetlands using remote sensing techniques. Since 2015, DUC has worked with the Evergreen Learning and Innovation Society (ELIS), and as part of this relationship DUC’s remote sensing team produced the first wetland classification at the Evergreen Park in 2016. Recently, as a result of the Wetland Centre project, there was an opportunity for DUC to map additional wetlands at Evergreen Park.

2016 Wetland Classification at Evergreen Park, AB with 2019 wetland mapping study area outlined in Red. ©DUC

2016 Wetland Classification at Evergreen Park, AB with 2019 wetland mapping study area outlined in Red. ©DUC

What is Remote Sensing?

Remote sensing is the science of obtaining information about an object or area without being able to see or touch the object. Remote sensing information is typically gathered by satellites, fixed-wing, rotary aircrafts or drones. For the Evergreen Park project we made use of existing data sources collected by fixed-wing aircrafts and available from the County of Grande Prairie open data portal including, high-resolution aerial photos and lidar imagery at a resolution of 10 – 25 cm. Lidar uses light in the form of a pulsed laser to create high-resolution elevation products that can help distinguish wetland boundaries and wetland type. Lidar imagery can identify depressions on the landscape where water may collect, forming a wetland. In the image below, the darker tones on the right side of the Lidar image are low-lying flat areas. Whereas, the brighter tones represent higher-elevation uplands.

Left: aerial photo with a 10 cm resolution. Right: LiDAR data with a 10 cm resolution. The dark areas of the LiDAR imagery are depressions in the landscape whereas the white areas depict higher elevated terrain (canopy or high ground). ©DUC

Left: aerial photo with a 10 cm resolution. Right: LiDAR data with a 10 cm resolution. The dark areas of the LiDAR imagery are depressions in the landscape whereas the white areas depict higher elevated terrain (canopy or high ground). ©DUC

Using a combination of Lidar and high-resolution aerial photos we can classify wetland types based on the category of vegetation present (e.g., conifer vs. deciduous vs. graminoid [grass/sedge]) and its height. Nine wetland types were identified at Evergreen Park as part of the 2016 mapping project and no new wetland types were identified in 2019. These wetland types include: open water, emergent marsh, graminoid, shrubby and treed rich fen, and conifer, mixed wood, tamarack and hardwood swamp. To see photos of the wetland types, visit our previous blog post about exploring the fall wetlands at Evergreen Park.

Field Data Procedures

In addition to satellite imagery, we selected and visited on-the-ground field sites to confirm that what was interpreted in the satellite imagery is representative of what is on the ground. We (Becky Edwards and Leanne Mingo, DUC) conducted site visits at Evergreen Park in September 2019. The goal was to collect wetland data at as many sites as possible during our visit.

Field tablet with satellite imagery and field data. ©DUC

Field tablet with satellite imagery and field data. ©DUC

Each field site processed consisted of:

  1. Collecting a GPS way point at the site location;

  2. Taking pictures of the site;

  3. Filling out a field form and assigning a wetland class using DUC’s Field Guide of Boreal Wetland Classes. Examples of the information collected on the field form included: species present, species aerial coverage, and tree/shrub height; and

  4. Collecting peat depth measurements by inserting a peat probe into the ground until resistance, and record the depth listed on the probe*.

    *It is important to take peat depth measurements because peatlands can store up to 98% of their total carbon below ground and there is a big need in this field to have a better understanding of the volume of peat for various types of boreal wetlands. Therefore, increasing our knowledge of peat and wetland types will increase our understanding of below ground carbon storage.

Left: Field crew taking a peat depth measurement using a peat probe. Right: Peat depth core.

Left: Field crew taking a peat depth measurement using a peat probe. Right: Peat depth core.

Due to the large amount of rain in Grand Prairie over the spring and summer of 2019, many of the wetland sites were too saturated to sample. Some of the tamarack swamp sites had five inches of standing water! In these cases, the field crew walked along the perimeter of the site to collect data.

Creating Maps

Once we returned from the field, I uploaded the data collected to a mapping software, ArcGIS, for analysis. I digitized the wetland boundaries in the project area based on the imagery and the wetland type verified in the field. Digitizing is the process of converting geographic data into vector data (point, line or polygon) by tracing the feature of interest. By using these methods, I produced a wetland inventory showing wetland extent and type across the entire Evergreen Park.

Updated 2019 wetland classification of the Evergreen Park with peat depth measurements.

Updated 2019 wetland classification of the Evergreen Park with peat depth measurements.

What comes next?

Equipped with an improved understanding of the wetlands at Evergreen Park, including mapped wetlands within and adjacent to the Wetland Centre project area AND additional peat depth measurements, we can use this information to help identify and plan future research, training, and demonstration opportunities.